Back in May at KubeCon + CloudNativeCon in Copenhagen I
wrote about the plethora of talks focusing on
Prometheus, an open-source systems monitoring and alerting toolkit. Just like any other distributed workload, it has always been possible to run Prometheus on DC/OS, but we've just made that significantly easier.
We're delighted to share that Prometheus is
now available in the Mesosphere DC/OS Service Catalog! With just a few clicks, you can install a Prometheus server, along with the AlertManager, PushGateway and web UI. Auto-discovery built in allows you to easily monitor your cluster and a variety of workloads you may already have running on DC/OS.
This introduction to the Prometheus package assumes you have the Marathon-LB package installed to expose the Prometheus service endpoints. If you're on Enterprise, you can also use Edge-LB as
defined in the service documentation.
Installation begins by either using the DC/OS Catalog in the web UI, or by simply running:
$ dcos package install prometheus
Once it is running, you'll want to expose the service endpoints via Marathon-LB. This will require a small proxy service running in a Mesos container that we create exclusively for exposing these ports.
Create a file called prometheus-proxy.json with the following contents:
{ "id": "/prometheus-proxy", "instances": 1, "cpus": 0.001, "mem": 16, "cmd": "tail -F /dev/null", "container": { "type": "MESOS" }, "portDefinitions": [ { "protocol": "tcp", "port": 0 }, { "protocol": "tcp", "port": 0 }, { "protocol": "tcp", "port": 0 } ], "labels": { "HAPROXY_GROUP": "external", "HAPROXY_0_MODE": "http", "HAPROXY_0_PORT": "9092", "HAPROXY_0_BACKEND_SERVER_OPTIONS": "server prometheus prometheus.prometheus.l4lb.thisdcos.directory:9090", "HAPROXY_1_MODE": "http", "HAPROXY_1_PORT": "9093", "HAPROXY_1_BACKEND_SERVER_OPTIONS": "server alertmanager alertmanager.prometheus.l4lb.thisdcos.directory:9093", "HAPROXY_2_MODE": "http", "HAPROXY_2_PORT": "9091", "HAPROXY_2_BACKEND_SERVER_OPTIONS": "server pushgateway pushgateway.prometheus.l4lb.thisdcos.directory:9091" }}
And use the command line tool to create the proxy app in Marathon:
$ dcos marathon app add prometheus-proxy.json
Now navigate to your
public agent address with :9092 appended to get to the Prometheus web UI. From here you can browse alerts and configuration as you'd expect. Prometheus native graphs can be shown through this UI, though it's also
easy to integrate with Grafana.
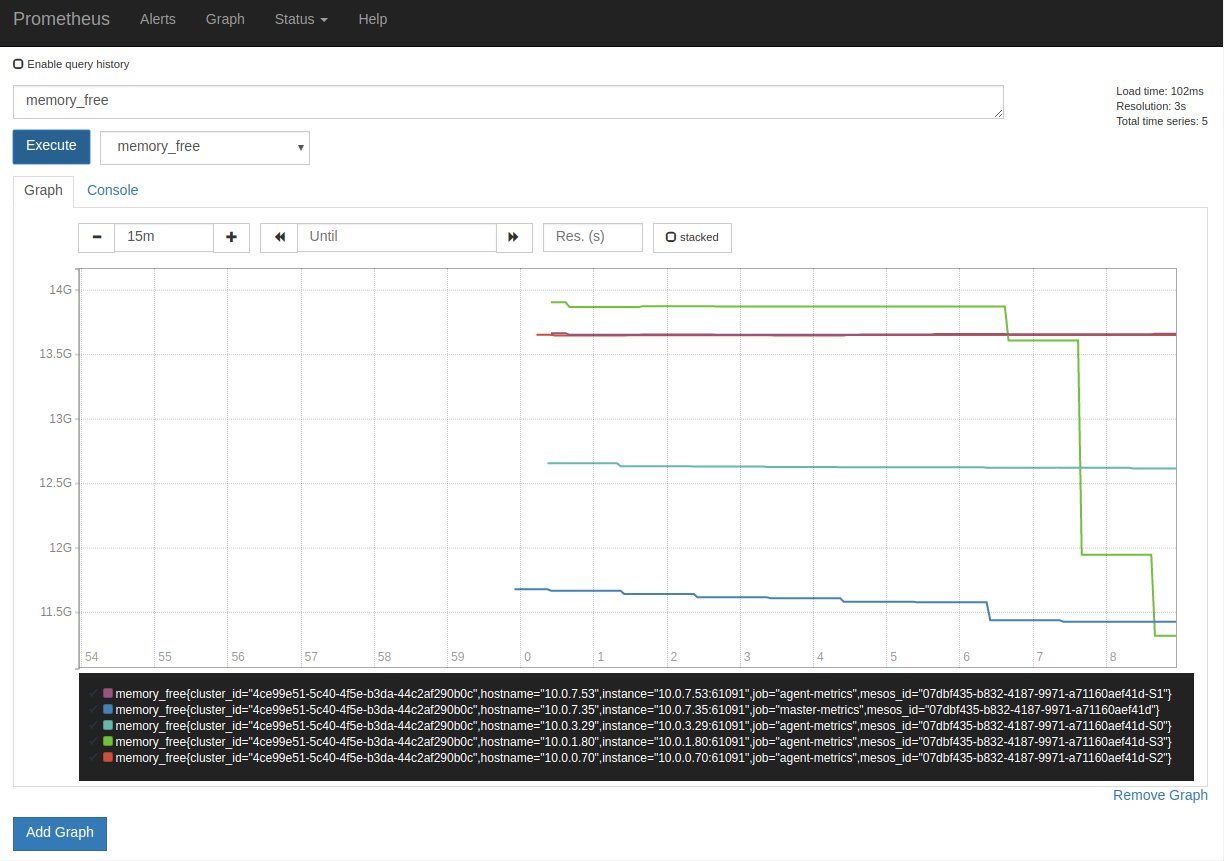
The native graphs can be used simply by using the expression browser under "Graph" where can see that data is already coming in by selecting one of the metrics from the dropdown. For instance, selecting "memory_free" will query the nodes on your cluster for the memory available, and you'll see changes over time by re-executing it as your services change across nodes.
Services sending metrics to
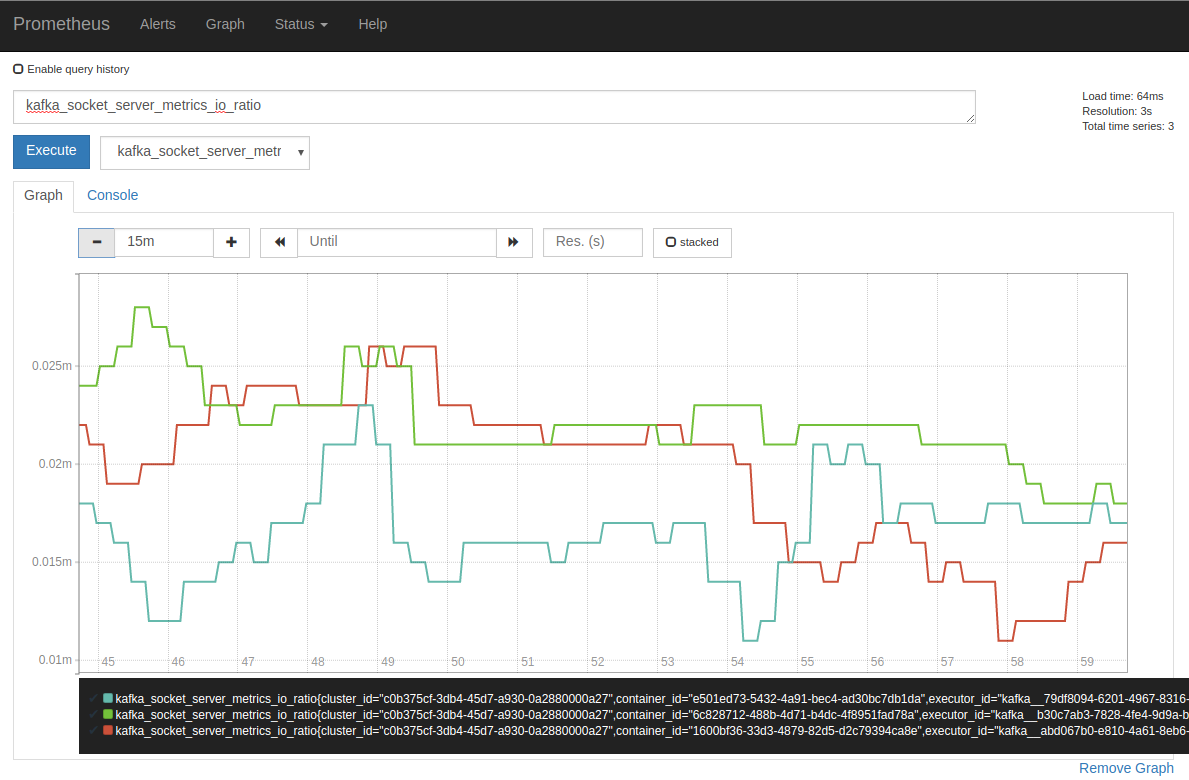
dcos-metrics will also be auto-discovered by Prometheus without any changes to the default configuration. In this graph, you can see some of the metrics coming out of Kafka, just one of dozens of metrics available from the Kafka service:
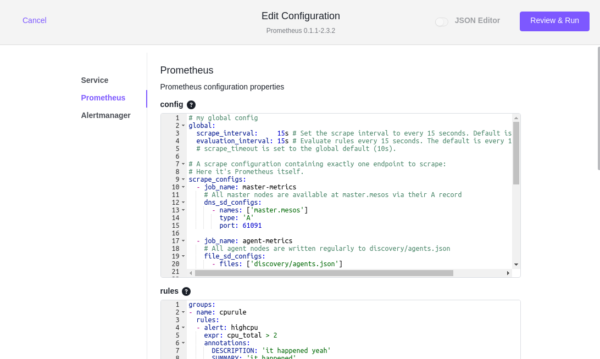
Parameters beyond the default can be added by editing your running Prometheus service and appending any changes. The prometheus.yml is located in the "Prometheus" tab of the configuration screen, and once changed will restart the scheduler to pick up the new configuration.
As mentioned, there is also a series of Prometheus CLI subcommands available via the DC/OS command line. If you installed Prometheus via the DC/OS web UI, you will need to install the CLI subcommands locally with the following command:
$ dcos package install prometheus --cli
Running the subcommand with the help flag will show you the full output of commands available to you:
$ dcos prometheus --help
The CLI allows you to dig into the DC/OS side of things, including the plans and pods, which can be valuable for
troubleshooting if anything fails to start. For instance, a successful deploy plan should report as follows:
$ dcos prometheus --name=prometheus plan status deploydeploy (parallel strategy) (COMPLETE)├─ alertmanager (serial strategy) (COMPLETE)│ └─ alertmanager-0:[server] (COMPLETE)├─ prometheus (serial strategy) (COMPLETE)│ ├─ prometheus-0:[server] (COMPLETE)│ └─ prometheus-0:[agent-discovery] (COMPLETE)└─ pushgateway (serial strategy) (COMPLETE) └─ pushgateway-0:[server] (COMPLETE)
Since this package also ships with the AlertManager and PushGateway available, you will also be able to configure both of those out of the box. The Prometheus Quickstart we've written
briefly covers both with examples and you can learn a bit more about alerting in the
Alerting Overview, which includes examples for sending notifications via Slack, PagerDuty, and email.

