The "12 Factor App" has been the backbone of cloud native applications on hyper-scale platforms for a long time (including Mesosphere DC/OS). As with any technical concept, over time they require updates or amendments to remain relevant. We humbly recommend that it's time to add a 13th factor; health checks. Health checks used to be the expertise of operations teams setting up load balancers and monitoring. However, with the move to continuous delivery and the need to scale microservices, the idea of health checks is increasingly moving into the application development sphere.
Modern platforms like Mesos and Marathon have simplified that process for development and operations teams.
This blog post discusses the fundamentals of health checks, and then demonstrates the application implementation of health checks using Mesosphere's Marathon scheduler running within DC/OS.
Health Checks
Health checking is the process where by a scheduler (like Marathon) or an application load balancer (like Marathon-LB, NGINX, or HAProxy) does periodic checks on the containers distributed across a cluster to make sure they're up and responding. If a container is down for any reason, the scheduler and/or load balancer will detect this and stop sending traffic to the container and, ideally, try to restart it.
Health checks have also been historically called called keep-alives or other product specific terms, but it's all the same: Make sure the microservice is still alive.
One of the misconceptions about health checking is that it can instantly detect a failed server. It can't, because health checks operate within a window of time that is dependent upon a couple of factors:
- Interval (frequency health check is performed)
- Timeout (how often does Marathon waits before failing and trying a restart)
- Count ( Marathon will try several times before marking a server as "down" and restarting)
As an example, take a very common health check configuration:
- interval setting of 15 seconds,
- timeout of 20 seconds,
- count of 3 to restart the task
Assuming a microservice failure, how long does it take to flag as unhealthy?
Worst case scenario for time to detection, the failure occurred right after that last successful health check, so that would be about 14 seconds before the first failure was even detected. The health check fails once, so we wait another 15 seconds before the second health check, we wait the final 15 second interval before the third health check fails and we've got a microservice marked as failed before the scheduler restarts the task or app. The timeout value overrides all parameters if the health check timeouts out, and the restart in your scheduler will begin.
Health Checks should be part of a code walkthrough for a microservice or any long term service under development. The obvious "worst-case practice" is to omit a health check. There is no clear cut "best practice" and that is why it is wise to have others challenge a microservice developers decision on the health check implementation. Minimally a health check:
- Should be included in an exception block, where any triggered exception returns an error state
- Should exercise microservice dependencies -- queue depth in pipelines, responsiveness from, data sinks, etc...
- Should return an agreed upon success or failure value, for example HTTP checks use a 200 for success and 4xx for failures.
Health Check Design
Cloud Native apps should incorporate a /health or /healthcheck API entry point for external schedulers (like Marathon in DC/OS) or load balancers to evaluate the microservice's health. Intentional health check design will ensure proper operation of the service over the lifecycle of the service.
Swagger (swagger.io and the Swagger Editor shown above) is a great tool to design both your microservices API, as well as the endpoint for the health check. Swagger also offers an array of code generation options to stub out your microservice from the API design. The following shows the rich selection of server side code generation options.
Configuring Health Checks with Mesosphere's Marathon
Marathon offers several options for health check configuration that includes the following protocol support for health checks for:
- HTTP
- HTTPS
- TCP
- Command
- Mesos_HTTP
- Mesos_HTTPS
The path attribute is only used for HTTP, HTTPS, Mesos_HTTP, and Mesos_HTTPS.
{
"path": "/api/health",
"protocol": "HTTP",
"gracePeriodSeconds": 300,
"intervalSeconds": 60,
"timeoutSeconds": 20,
"maxConsecutiveFailures": 3,
"ignoreHttp1xx": false
}
The following 4 attributes are common to all Health Checks:
- gracePeriodSeconds (Optional. Default: 300) - Health check failures are ignored within this number of seconds or until the app becomes healthy for the first time. intervalSeconds (Optional. Default: 60): Number of seconds to wait between health checks.
- maxConsecutiveFailures (Optional. Default: 3) - The number of consecutive health check failures when the unhealthy app should be killed. HTTP & TCP health checks: If this value is 0, tasks will not be killed if they fail the health check.
- timeoutSeconds (Optional. Default: 20) - The number of seconds after a health check is considered a failed regardless of the response.
- ignoreHttp1xx (Optional. Default: false). - Ignore the HTTP information 100-199 messages.
Marathon allows custom commands to be executed for health. These could be defined in your Dockerfile as an example.
{
"protocol": "COMMAND",
"command": { "value": "source ./myHealthCheck.sh" }
}
Applications or Containers deployed in Marathon are typically "scaled" to a single instance or 1 as seen below as an example.
As load increases, scale can increase as defined by the "scale metric" (e.g. CPU, Memory) which is represented as the "requested instances." as well as scale can decrease after a system load event or as the "scale metric" decreases. The following FSM depicts the health lifecycle in Marathon.
Legend: i = requested instances
r = running instances
h = healthy instances
DC/OS Marathon Configuration
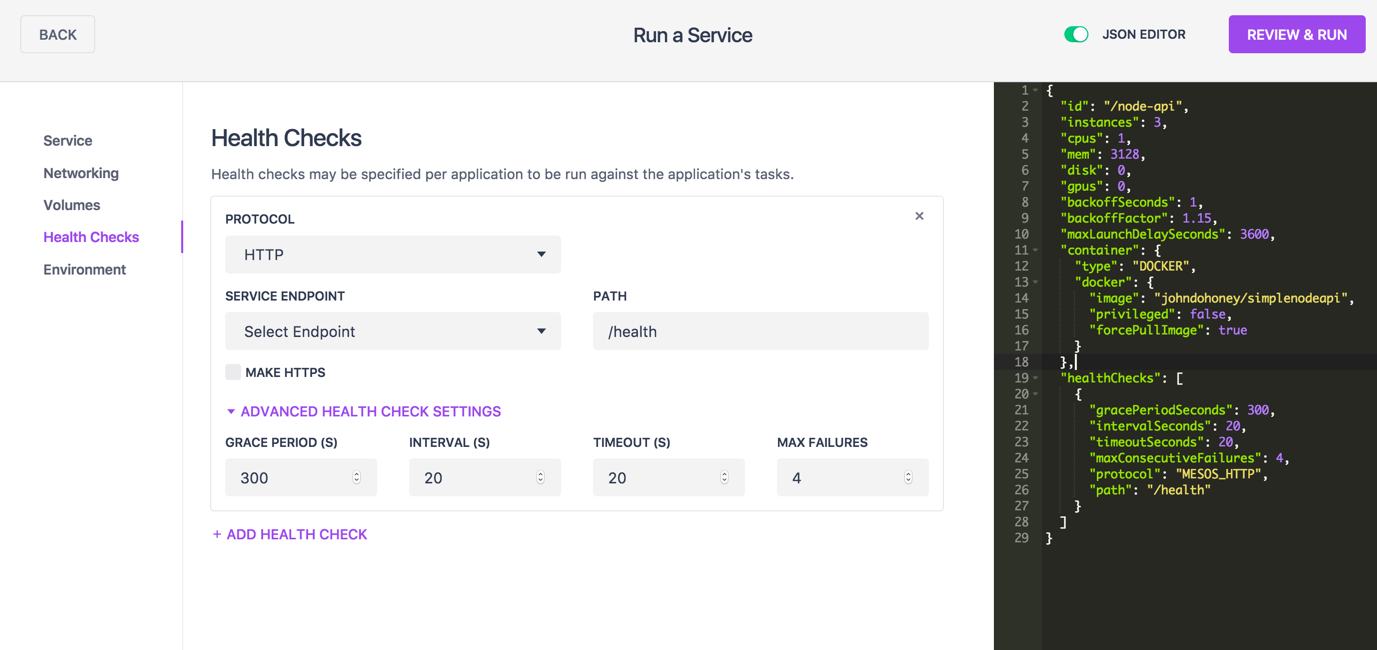
DC/OS contains a helpful editor that helps architects and developers create the JSON configuration necessary to launch a microservice and its associated health check. The editor has a helpful dialogue to guide you the first few times as well as a side-by-side display of the Marathon configuration JSON file.
As you make changes in the Configuration editor, watch the changes in the JSON window. Also, the JSON editor is live, so the configuration dialogs are also updated. Once your Marathon configuration is to your requirements, press the "Review & Run" button to deploy your micro service on Marathon.
The link below will take you to a GitHub project of a simple Node.js micro service. The easiest way to experiment with DCOS and its powerful monitoring and scaling features is to load one of our cloud or vagrant configured systems. These systems can be found at
https://dcos.io/install.
To clone the repo on your laptop: git clone https://github.com/john-dohoney/DCOS-Marathon-Simple-Server.git
The READ.ME on the GitHub repo will guide you through the usage of the sample code
Enjoy!

